Stellar Navigation Using Network Analysis
05 Dec 2014Intro
Idea
The Data
How Far Do We Have To Go?
Key Star Systems
Charting a Course
3D Visualizations
Conclusions
Intro
This has been the funnest and most challenging network analysis and visualization I have done to date. As I've mentioned before, I am a huge space fan. One of my early childhood fantasies was the idea of flying instantly throughout the universe exploring all the different planets, stars, nebulae, black holes, galaxies, etc. The idea of a (possibly) infinite universe with inexhaustible discoveries to be made has kept my interest and fascination my whole life. I identify with the sentiment expressed by Carl Sagan in his book Pale Blue Dot:
In the last ten thousand years, an instant in our long history, we’ve abandoned the nomadic life. For all its material advantages, the sedentary life has left us edgy, unfulfilled. The open road still softly calls like a nearly forgotten song of childhood. Your own life, or your band's, or even your species' might be owed to a restless few—drawn, by a craving they can hardly articulate or understand, to undiscovered lands and new worlds.
Herman Melville, in Moby Dick, spoke for wanderers in all epochs and meridians: "I am tormented with an everlasting itch for things remote. I love to sail forbidden seas..."
Maybe it's a little early. Maybe the time is not quite yet. But those other worlds— promising untold opportunities—beckon.
Silently, they orbit the Sun, waiting.
Idea
With this spirit of exploration in mind I wondered to myself how, exactly, would one go about navigating the stars. Perhaps due to my being older and wiser (and/or losing my childhood imagination), my fantasies regarding exploring the universe now come attached to limitations and practicalities. Stellar travel is beyond our technical abilities; what with our inability to wield space-time, finite life-spans, and technical inabilities and all. But if we could manage even a relatively modest amount of stellar travel, what would that modest amount have to be to open the network of our stellar neighborhood to us? And what would that 3-dimensional network look like?
So, I imagined our Sun surrounded by its immediate neighborhood and saw a network of pathways one could take given a limit on how far you could travel before having to "refuel" at the next star system--say, perhaps, via mining asteroids or by deploying your solar charger.
With this idea in mind, I took the first step and went searching for data.
The Data
I am very fortunate to have a friend, Joseph Smidt, who works at the Los Alamos National Laboratory specializing in cosmology. I mentioned the idea to him and asked if he knew of any accessible datasets to start with. He pointed me at a Gliese astronomical dataset with 2223 of the closest stars. It's an older dataset, but it was perfect for what I needed.
A note on the data: It's important to realize that this dataset is biased towards our sun. The dataset, naturally, radiates from our solar system since it is the location from which all of the observations were made. The stars on the outside edges of the dataset aren't outliers in our actual cosmic neighborhood but merely outliers to this dataset. If I pulled in more data, I'd (more or less) expect the structure of stars to continue barring any larger galactic structures. The data is also a bit dated. As I've looked at more modern star catalogues, I've noticed occasional corrections regarding binary systems and locations.
Here's the original star data: stars.txt
Here are the generated gml files for 6-14ly networks: stellar-graphs.tgz
How Far Do We Have To Go?
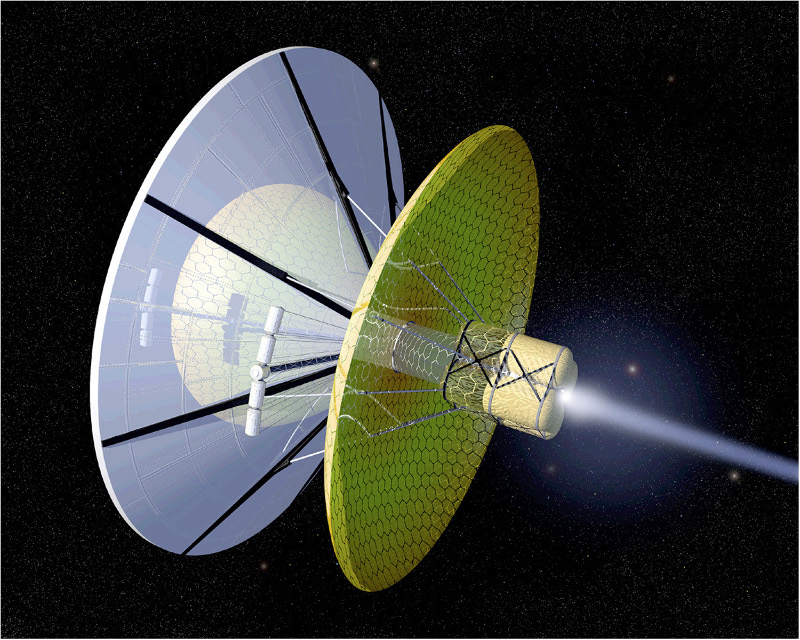
Artist depiction of a Bussard Ramjet starship. Credit NASA.
Again, the network I'm building is based on an arbitrarily imposed maximum travel distance. Practicalities like energy used to bend space-time, resources for hyper-sleep, or simple raw materials needed for the journey could impose the kinds of practical limitations my childhood mind never imagined. Given the closest neighboring star (actually stars) is the Alpha Centauri system at ~4.3 light years away, any limitation less than that would rule out any stellar travel. And given the farthest star in the dataset is ~74.9 light years away, I figured a max distance somewhere in this range and closer to the 4.3 side than the 74.9 side would allow us to hop between stars and travel the neighborhood.
One way to do this would be to find the max of minimum distances separating all the stars. But since I knew I wanted to visualize this as a network, I decided to let network analysis determine this for me. This turned the question into the problem of identifying what max distance would create a network with a single component. Too small a value, and the network would be made of many separated components.
Curious how changing the max distance would affect how disconnected the network would be, I ran a network component detection algorithm on 10 different networks having a max distance between 5 light years and 14 light years (choosing to use whole number granularity).
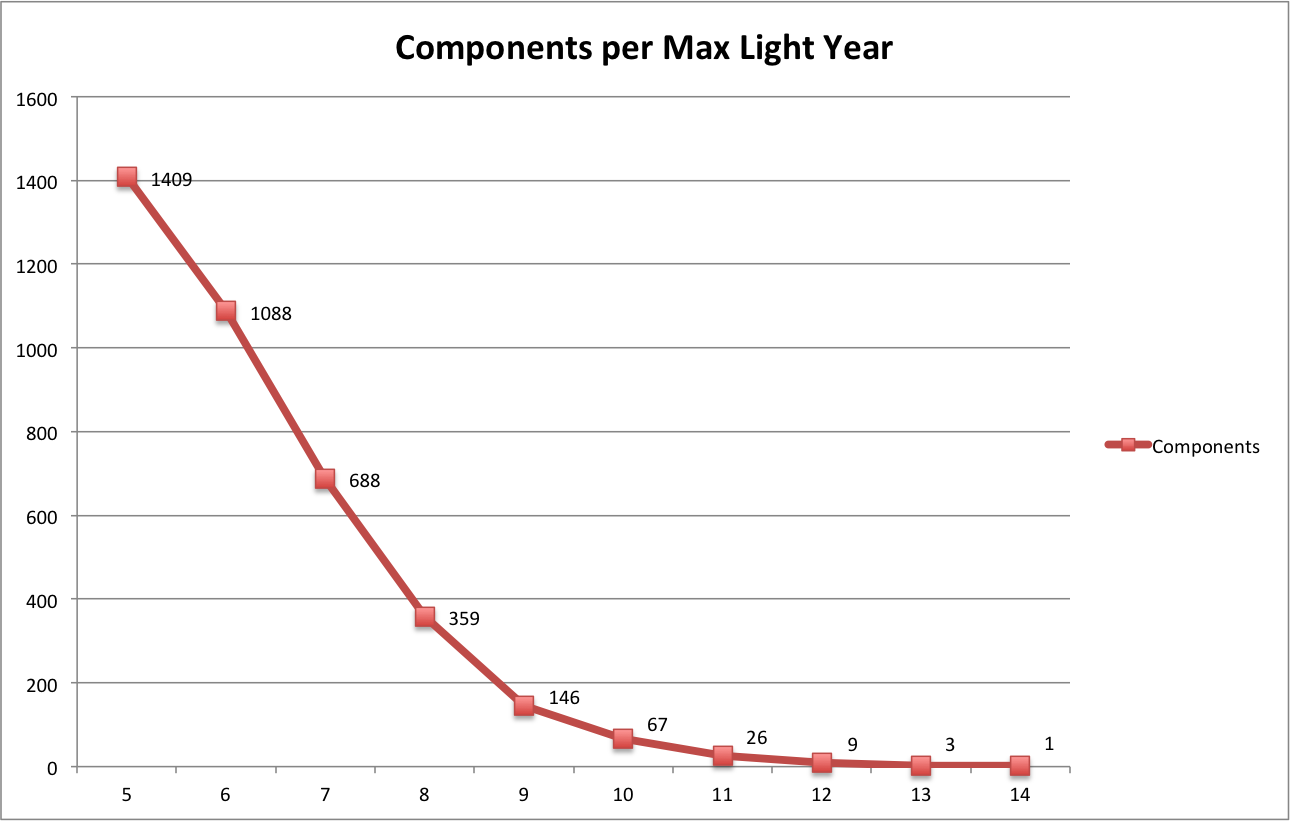
It turns out that 14 light-years is the minimum max distance needed to make travel to every star in the dataset possible. It may be between 13 light-years and 14 light-years, but I'm using whole number granularity. Now, this number may be a bit high since, as mentioned above, our dataset is biased towards the Sun. It may be harder with this data than it actually may be to chart a course to the stars on the outer edges since we lack a full picture of what other stars may exist just beyond this dataset which may offer a more accessible pathway. It may be that somewhere between 9 or 12 light-years may be a max distance that fully connects the network. In fact, when I look at a 9ly network and filter out it's main central component, all but a few of the stars in other isolated components have either a large x, y, or z coordinate indicating that they lie on the outside edge of the dataset.
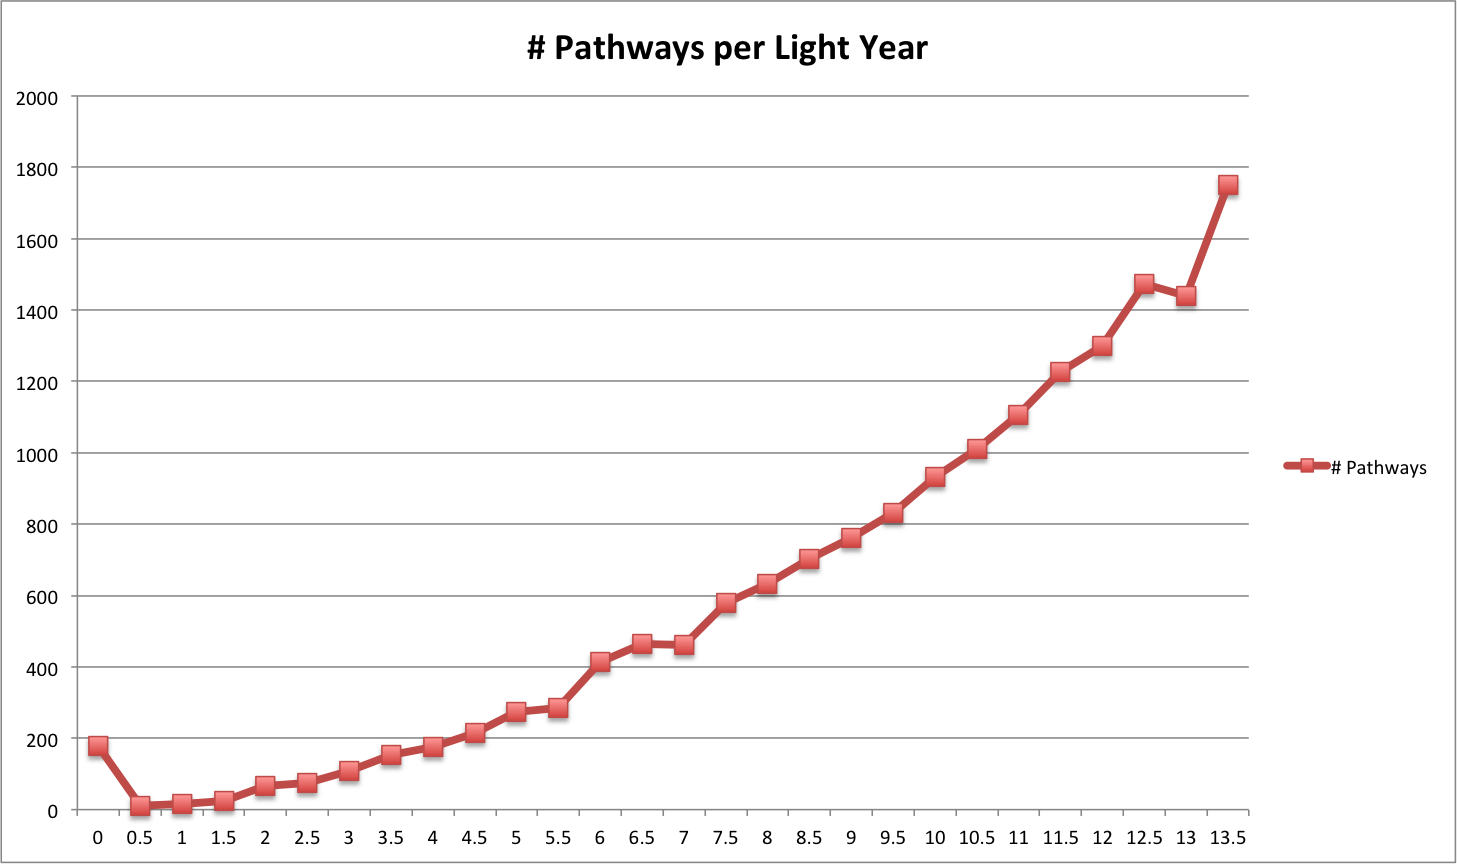
Looking at the distribution of pathways for the 14ly max distance network, the trend looks fairly smooth until around the ~12ly mark where abnormalities occur.
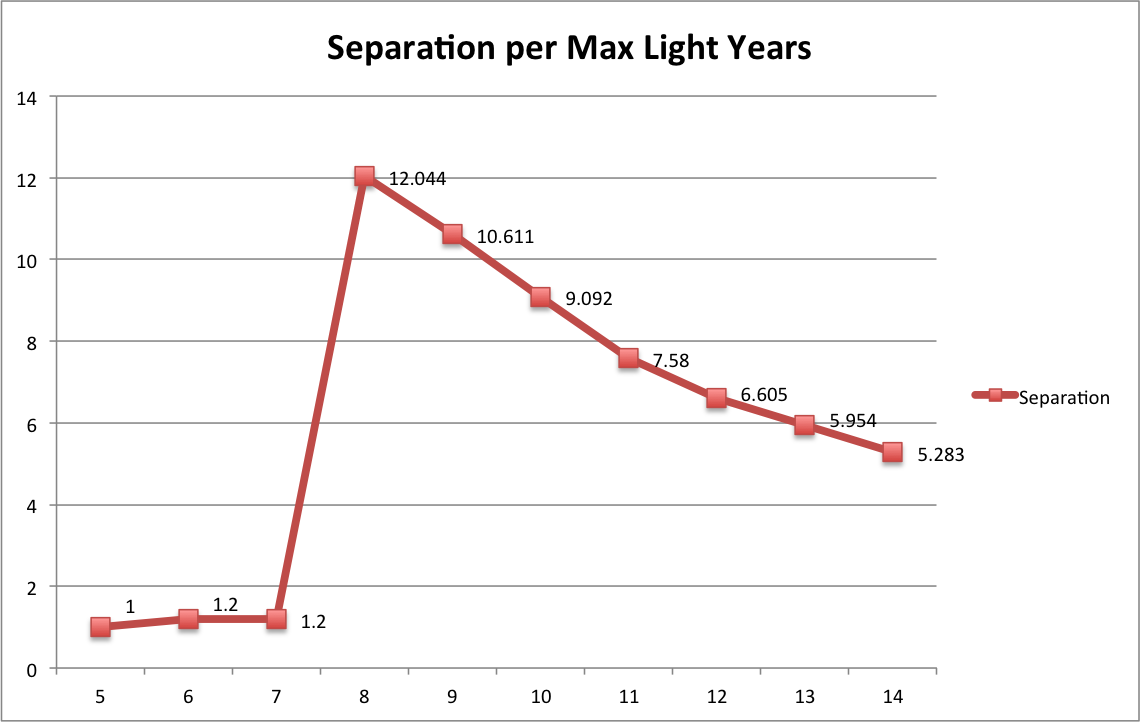
Another approach to finding what max distance would allow us to traverse the stars is by looking at how many stars in this dataset would be reachable to us given different max distances. This is what that looks like plotted against different max distances:
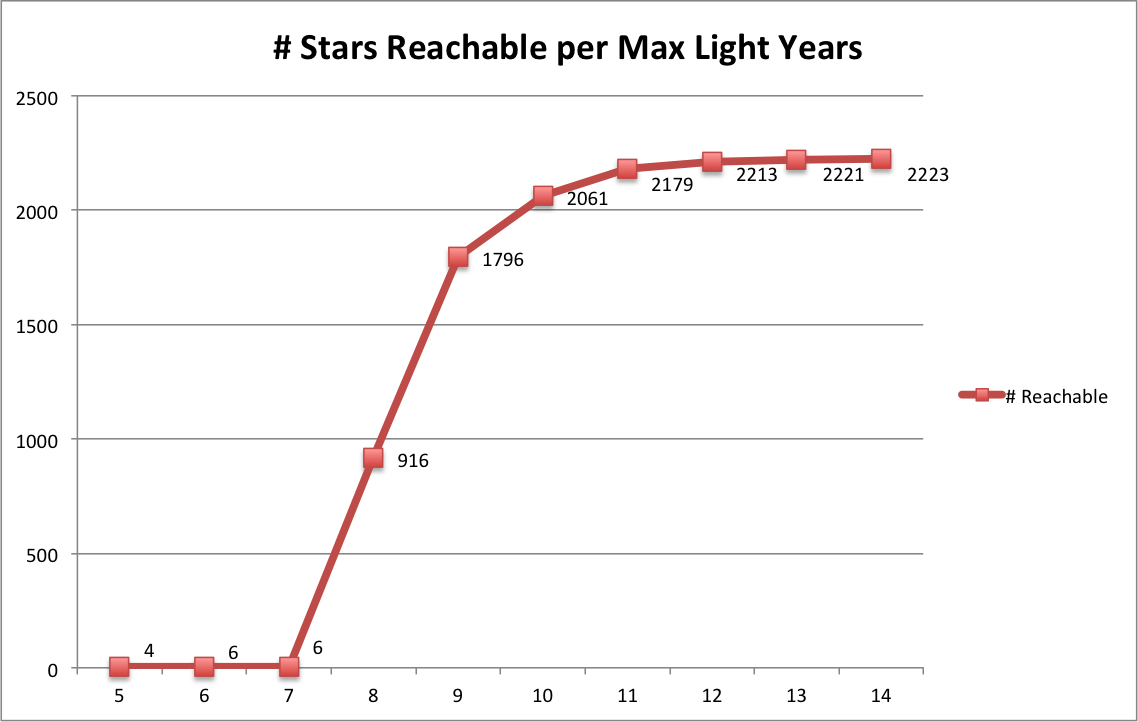
Here too we can see that there isn't much difference between 12ly to 14ly. Note that if, for some reason, 12ly travel was prohibitive, even travel of 8ly or 9ly would begin to open up the stars. However, 5ly to 7ly would confine us to just a few of the closest stars.
From this, an estimate of ~12 light years seems like a reasonable answer to the question of how far we'd have to be able to travel in one trip in order to traverse our local stellar neighborhood.
Key Star Systems
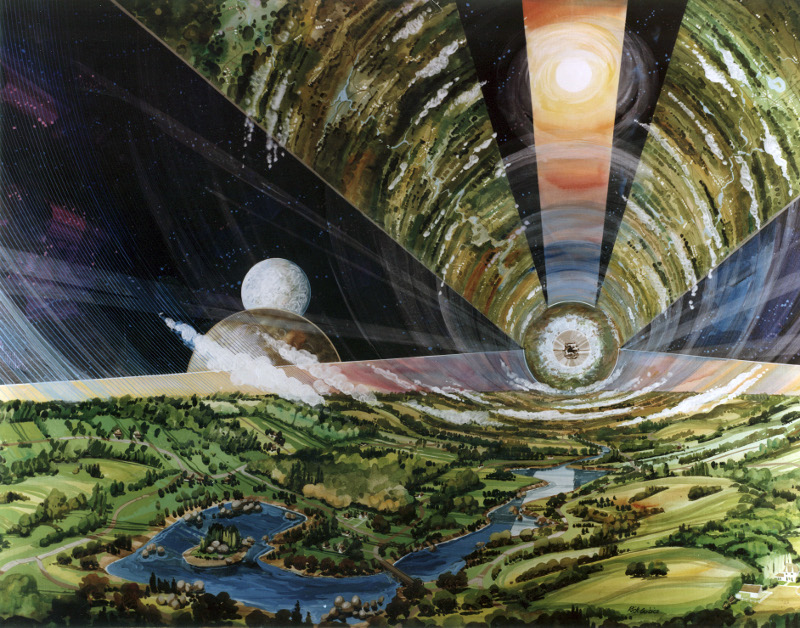 Artist depiction of an O'Neill Cylinder.
Credit NASA.
Artist depiction of an O'Neill Cylinder.
Credit NASA.
Before I move on to what these 3D networks actually look like, I wanted to quickly point out star systems that make up key connectors. If the goal here is to analyze how we'd traverse our stellar neighborhood, an interesting question is, "Which stars would be most often trafficked?" This is interesting for a few reasons:
First, if we were to identify common traveling routes, we'd probably want to setup permanent way stations. I imagine communities and cultures springing up in these systems as economic opportunities would follow traffic patterns.
Second, perhaps more immediately interesting, is when we consider the idea that perhaps this traffic already exists. Maybe stellar navigators already regularly traverse our local stellar neighborhood but we've yet to join (or be invited) to this larger community. Given our efforts to identify intelligent life beyond our own, identifying stars that would be more frequently travelled given the max distance assumption above could aid in that search.
Third, if a stellar-faring civilization were looking for signs of other stellar-faring civilizations, they might also look at these same systems for signs of activity or for places of contact. These systems could serve as rendezvous points in the galaxy between civilizations.
So, given our estimate that the ability to travel 12 light years would be sufficient for stellar travel, what would be the most commonly visited stars in our immediate stellar neighborhood? In network analysis this is the problem of betweenness centrality. Now, again, this dataset is biased towards our Sun. It may be that given a larger dataset that stars on the edge of this dataset may be key connectors. But, even given this limitation, we can have some idea of which stars in the context of this dataset may be more frequently travelled.
One caveat to this is that it assumes all stars are equally useful as way points for stellar travel and it does not take into account anything in the vicinity of pathways which may make that pathway impassible or more costly to traverse. A more complex analysis would have to take those into account. But, for now, a broad assumption treating all systems the same seems reasonable for the scope of this write up.
Here's a 2D visualization of a 12ly network with nodes sized by their betweenness centrality score (larger for higher scores). I used Gephi to do the betweenness calculation and visualization. Note, the colors used are based on the Harvard spectral classification system taking into account merely the temperatures of the stars.
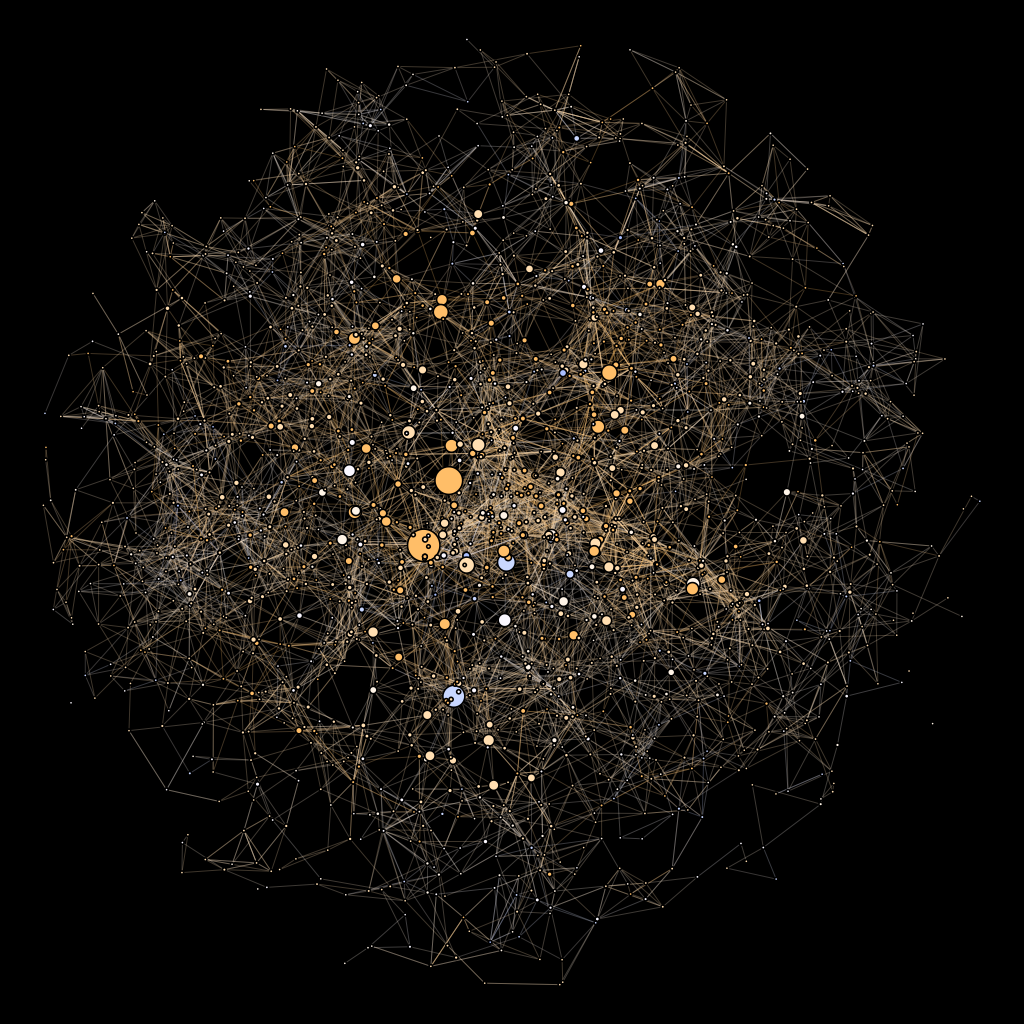
Interestingly, the Sun is not at the top of this list despite the heliocentric nature of this dataset. In fact, it is 49th on this list. Here are the top 5 star systems based on their centrality score:
- NN-3192A - Also known as the Luyten 730-18 System. A suspected double star system. It is located ~24.8ly from the Sun.
- Gl-83.1 - Also known as L 1159-16, a red dwarf flare star in the constellation Aries (though not visible with the naked eye). It is ~14.6ly away from the Sun.
- Gl-318 - A white dwarf star located in the constellation Pyxis ~29.0ly from the Sun.
- NN-3716 - Also known as 12 Virgins (HIP 59608). It is a type A2 star in the constellation Virgo. It is ~22.1ly from the Sun.
- Gl-91 - A red dwarf star in the constellation Fornax ~30.0ly away from the Sun.
Charting a Course
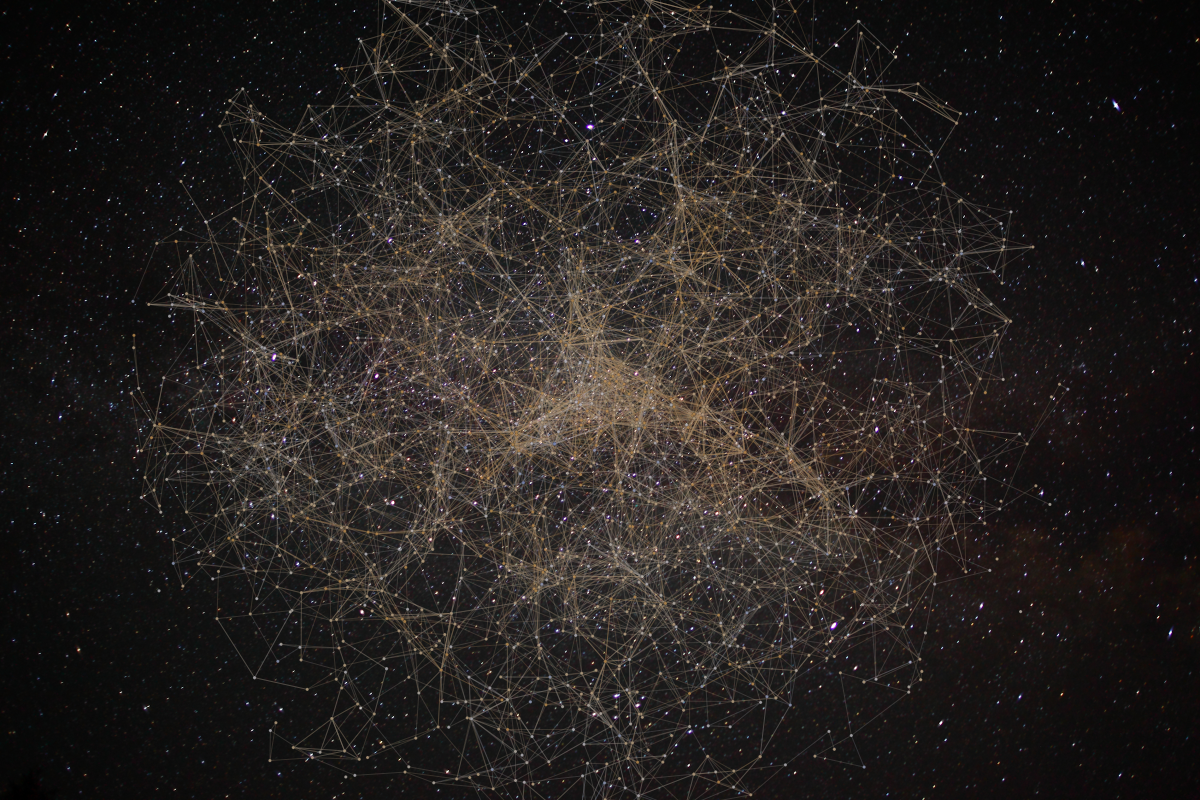
2D rendering of a 12ly stellar network with a night sky photo background. Night sky background photo credit ForestWander.
Now that we have a graph that can be used to plot courses to the stars, how, exactly, can this be done? This is what Dijkstra's Algorithm is designed to do. It calculates shortest paths between nodes in a graph. To do this, I exported the graph to graphml and used the neo4j-shell-tools to import it into Neo4j. Once in Neo4j, I used the Dijkstra PathFinder feature to calculate the optimal pathway from the Sun to places of interest.
Before I show how we would travel to these destinations from the Sun, I wanted to point out how the max distance affects the number of stars, on average, a stellar navigator would expect to take given they start from the Sun. In graph theory this is referred to as the Erdős number. Popularly, this is most commonly understood as the 6 Degrees of Separation or "small world" phenomenon. Here's a plot of the average degree of separation between the Sun and the other stars given different max distances. Note that the Erdős number is low at first due to the fact that these low max distances confine us to only the few systems closest to us (see reachable chart above).
Interestingly, a max distance value of 12ly creates a network with an average degree of separation close to 6.
Another chart which helps to understand the structure of the 12ly network is the degree distribution--a distribution of the number of pathways to or from stars in the network:
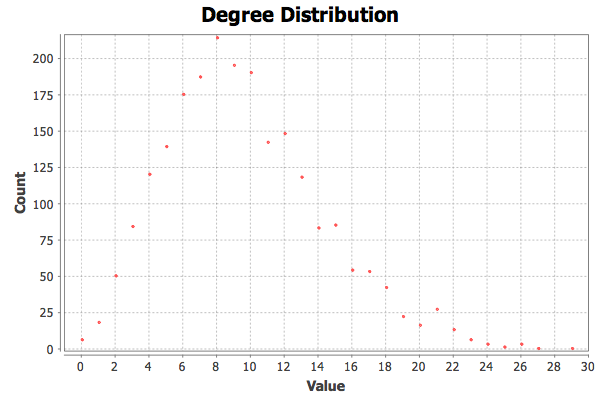
The average degree is ~9.6. Degrees have a range from 0 to 29 and the distribution is more-or-less normal centering around ~8.
In selecting a handful of stars to chart a course to, I wanted to look for systems which have known unique attributes. I selected 8 stars, 7 which have interesting attributes and the top star from the list of top centrality systems above. Note that since the dataset I have is older, some of these distances have since been adjusted slightly. However, some distances have been adjusted significantly. I'll call those out. Another caveat to these navigational pathways is that these stars do not sit statically relative to each other. They are in constant motion. For simplicity, I'm ignoring that.
| Star | Pathway |
|---|---|
| Gl-882 - Known as 51 Pegasi, 50.1ly from the Sun in the constellation Pegasus. This star has the first exoplanet ever discovered orbiting a Sun-like star. |
Sun -> Gl-65A (~8.56ly) Gl-65A -> GJ-1002 (~8.35ly) GJ-1002 -> GJ-1286 (~8.77ly) GJ-1286 -> GJ-1276 (~5.56ly) GJ-1276 -> Gl-852B (~8.45ly) Gl-852B -> GJ-1263 (~9.86ly) GJ-1263 -> NN-4239 (~4.25ly) NN-4239 -> NN-4279 (~9.10ly) NN-4279 -> Gl-863 (~4.78ly) Gl-863 -> NN-4306 (~8.81ly) NN-4306 -> Gl-882 (~6.30ly) Total hops: 11 Total distance: ~82.84ly |
| Gl-667 - A triple-star system in the constellation Scorpius about 23.29ly from the Sun. It has two confirmed planets in its system orbiting around one of its stars (Gl-667C). One of these exoplanets (Gl-667Cc) currently has the highest Earth Similarity Index of any confirmed exoplanets. |
Sun -> Gl-729 (~9.56ly) Gl-729 -> Gl-663B (~9.18ly) Gl-663B -> Gl-667C (~6.61ly) Total hops: 3 Total distance: ~25.35ly |
| Gl-710 - A star in the constellation Serpens Cauda 45.49ly away from the Sun (note: further corrections now place this star 63.8ly). Gl-710 is interesting because it's path will place it within 1ly from our Sun in ~1.4 million years. This could lead to a disruption of the Oort Cloud increasing chances of an impact event on Earth. |
Sun -> Gl-729 (9.56ly) Gl-729 -> Gl-702B (9.19ly) Gl-702B -> Gl-673 (9.58ly) Gl-673 -> Gl-678.1A (7.53ly) Gl-678.1A -> Gl-688 (7.88ly) Gl-688 -> NN-4056 (9.82ly) NN-4056 -> Gl-710 (2.99ly) Total hops: 7 Total distance: 56.57ly |
| Gl-541 - Known as Arcturus, ~35.7ly away in the constellation Boötes. It is the fourth brightest star in the night sky and has a long history with mankind. |
Sun -> Gl-406 (~7.79ly) Gl-406 -> Gl-473A (~7.61ly) Gl-473A -> GJ-2097 (~8.08ly) GJ-2097 -> Gl-512.1 (~9.02ly) Gl-512.1 -> Gl-541 (~9.69ly) Total hops: 5 Total distance: 42.21ly |
| Gl-370 - ~31.6ly (currently estimated at ~35ly) from the Sun in the constellation Vela. I has a potentially habitable planet HD-85512-b. |
Sun -> Gl-406 (~7.79ly) Gl-406 -> Gl-388 (~8.74ly) Gl-388 -> Gl-402 (~8.17ly) Gl-402 -> Gl-382 (~8.29ly) Gl-382 -> Gl-357 (~9.98ly) Gl-357 -> Gl-318 (~8.37ly) Gl-318 -> Gl-370 (~9.40ly) Total hops: 7 Total distance: ~60.78ly |
| Gl-581 - ~20.6ly from the Sun in the constellation Libra. This system has been a focus of study for its potentially habitable planets; though most recent studies have cast some doubt on the habitability of those planets. |
Sun -> Gl-699 (~5.98ly) Gl-699 -> Gl-628 (~8.50ly) Gl-628 -> Gl-581 (~8.99ly) Total hops: 3 Total distance: ~23.48ly |
| Gl-721 - More commonly known as Vega (~25.1ly from the Sun), has been extensively studied by astronomers boasting many first discoveries in astronomy. Like Arcturus, it too has had human cultural significance. |
Sun -> Gl-699 (~5.98ly) Gl-699 -> Gl-725A (~9.43ly) Gl-725A -> Gl-687 (~4.71ly) Gl-687 -> Gl-661A (~8.69ly) Gl-661A -> Gl-721 (~8.22ly) Total hops: 5 Total distance: ~37.04ly |
| NN-3192A - Also known as L 1159-16, a red dwarf flare star in the constellation Aries (though not visible with the naked eye). It is ~14.6ly away from the Sun and is the star with the highest centrality score in the 12ly stellar network. |
Sun -> Gl-244B (~8.57ly) Gl-224B -> Gl-234A (~5.59ly) Gl-234A -> Gl-205 (~6.78ly) Gl-205 -> Gl-185A (~9.51ly) Gl-195A -> GJ-2033 (~8.78ly) GJ-2033 -> Gl-150 (~4.76ly) Gl-150 -> NN-3192A (~8.88ly) Total hops: 7 Total distance: ~52.90ly |
3D Visualizations
One challenge in accurately visualizing this data is that it has 3 spatial dimensions. Every graph/network visualization I've done before either didn't have spatial dimensions or merely had 2D geo-spatial dimensions. This is a challenge because most graph tools are oriented towards a 2-dimensional layout and visualization. Gephi, a tool I commonly use, does 2-dimensional visualizations. It is aware of 3D coordinates of nodes and can do an okay job of representing it in 2-dimensions. But with no ability to pan, it's hard to get a real feel for what the 3D structure of the network looks like.
After some hunting, I found NAViGaTOR which was created and is actively maintained by the Jurisica Lab of the Ontario Cancer Institute. Although it has the ability to do 3D layouts, none of its layouts support coordinate-based layouts from node data. However, after some experimentation, I discovered that if you disable the option which automatically applies a layout on network load, that the default behavior is actually to lay the network out based on node 3D coordinate data. I contacted a maintainer of NAViGaTOR and they confirmed that that is indeed the expected behavior.
I maintained the node coloring based on star temperature above. However, I made every node have equal size.
I've gone into plenty of detail already in the above analysis, so I'll simply show what the 3D structure of a few different max distance networks looks like.
8 Light-year External Visualization
8 Light-year Internal Visualization
9 Light-year External Visualization
12 Light-year External Visualization
12 Light-year Internal Visualization
Conclusions
As I mentioned above, this analysis and visualization has required a huge effort for a blog I work on in my spare time. But it has also been very fulfilling. It's been, in part, a fulfillment of a childhood dream and was exciting to see skills that I've gained in my career be able to arc back towards that childhood. It was also a great opportunity to bring together several technologies: Tinkerpop, Gephi, Neo4j, and NAViGaTOR. I've long thought about how to do this kind of 3D network visualization, and it was great to see these technologies work together to produce these results.
But separately from personal take-aways, it was fascinating to see the results from the dataset. The data bears out the ~12ly max distance necessary to traverse a well connected local stellar neighborhood. Once the network is formed, you can see what traffic patterns of hypothetical stellar-faring civilizations might look like. There are even several star systems that might be likely candidates for observing whether these traffic patterns already exist.
Finally, seeing the 3D networks for the first time really tied it all together for me. I felt a greater sense of connectedness to the astronomical neighborhood of which I am an infinitesimal, but very real, part. Contrasting this with the analysis I previously did of protein interactions in budding yeast reminds me of the observation by Blaise Pascal when he said:
Let him lose himself in wonders as amazing in their littleness as the others in their vastness. For who will not be astounded at the fact that our body, which [is] imperceptible in the universe, itself imperceptible in the bosom of the whole, is now a colossus, a world, or rather a whole, in respect of the nothingness which we cannot reach...
For in fact what is man in nature? A Nothing in comparison with the Infinite, an All in comparison with the Nothing, a mean between nothing and everything.